Introduction
Candlestick patterns are one of the most powerful and widely used tools in technical analysis.
Unlike indicators that lag price, candlesticks directly reflect market behavior, revealing how buyers and sellers interact in real time.
For traders, candlesticks are not just chart patterns — they are visual stories of market psychology, showing fear, confidence, hesitation, and aggression within a single candle.
This article covers:
- The history of candlestick charts
- What candlesticks represent
- Market psychology behind candles
- Why candlestick patterns are significant
- How to confirm patterns
- A basic trade setup using candlesticks
History of Candlestick Patterns

Candlestick charting originated in Japan more than 300 years ago.
It was developed by Japanese rice traders, most notably Munehisa Homma, who traded rice futures in Osaka.
Homma observed that price movement was not driven by supply and demand alone.
It was also heavily influenced by human emotions and crowd behavior.
This insight made candlestick charts one of the earliest forms of behavioral finance.
Centuries later, candlestick analysis was introduced to Western markets and is now used globally across:
- Stocks
- Forex
- Cryptocurrencies
- Commodities
- Indices
What Are Candlesticks?

Candlesticks are a price-action based charting method that shows the battle between buyers and sellers within a specific time period.
Each candlestick represents four key price points:
- Open price
- High price
- Low price
- Close price
From a single candle, a trader can understand:
- Who controlled the market (buyers or sellers)
- The strength or weakness of the move
- Potential trend continuation or reversal
In short, candlesticks turn raw price data into clear visual information.
Candlestick Psychology
Candlesticks reflect human emotions that drive financial markets:
- Fear
- Greed
- Hope
- Panic
The structure of a candle reveals this psychology:
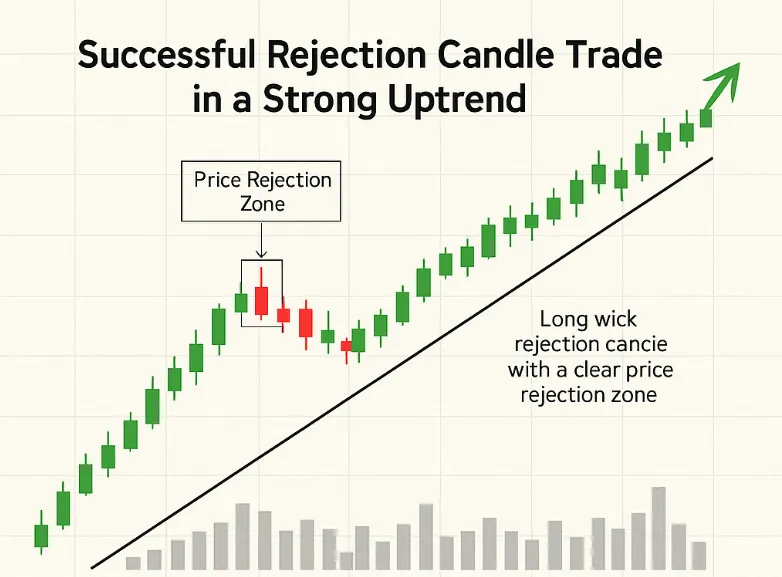
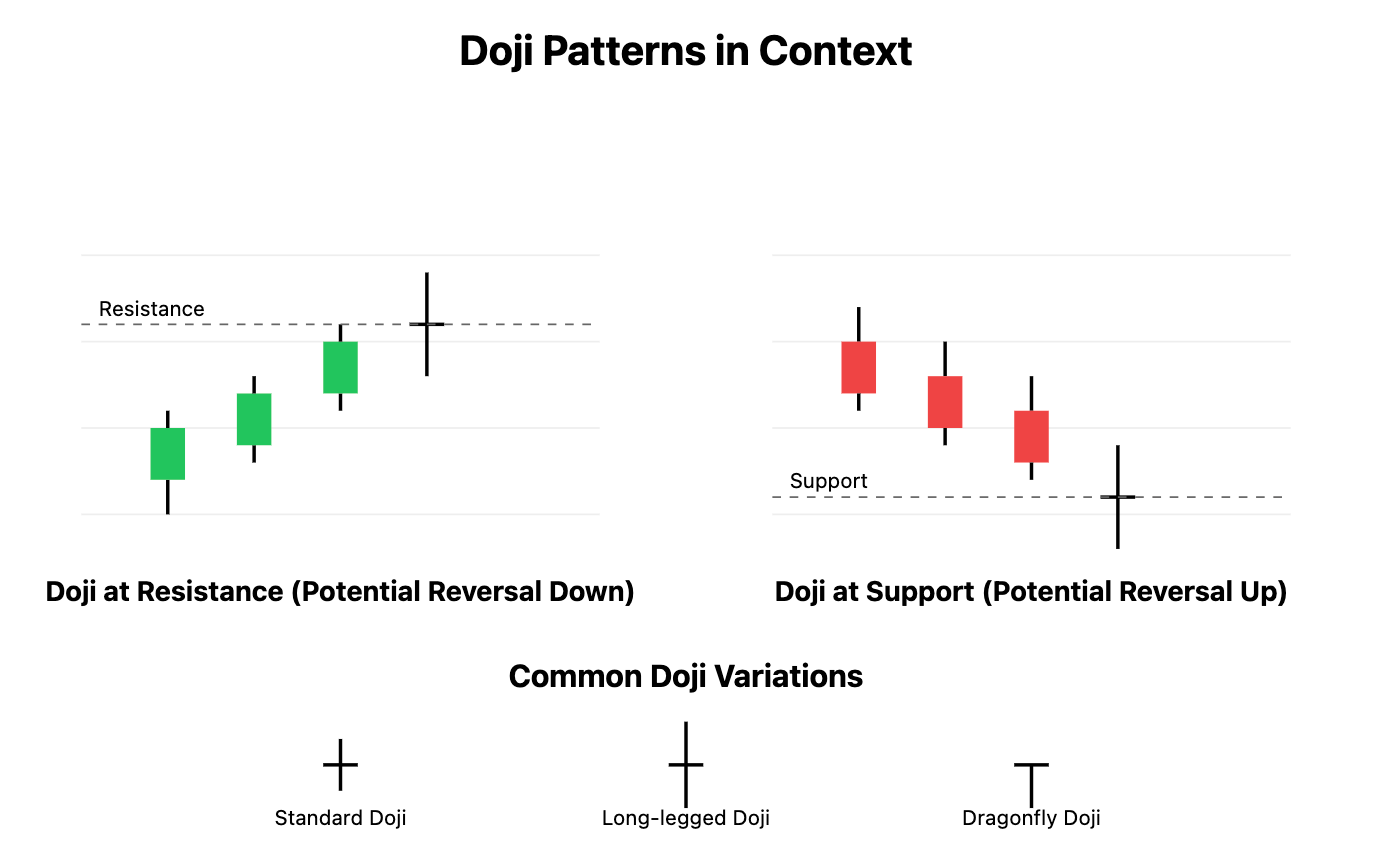
- Long wicks indicate rejection
- Large bodies show dominance
- Small bodies signal indecision
For example:
- A long lower wick means sellers pushed price down, but buyers stepped in strongly
- A long upper wick means buyers attempted higher prices but were rejected by sellers
Every candlestick tells a story of demand versus supply.
Significance of Candlestick Patterns

Candlestick patterns are important because they:
- Appear before indicators react
- Help traders time entries and exits
- Work across all markets and timeframes
- Are highly effective near support and resistance zones
However, candlestick patterns are most reliable when:
- They form at key price levels
- They align with the overall trend context
A pattern without context is noise.
A pattern at the right location is information.
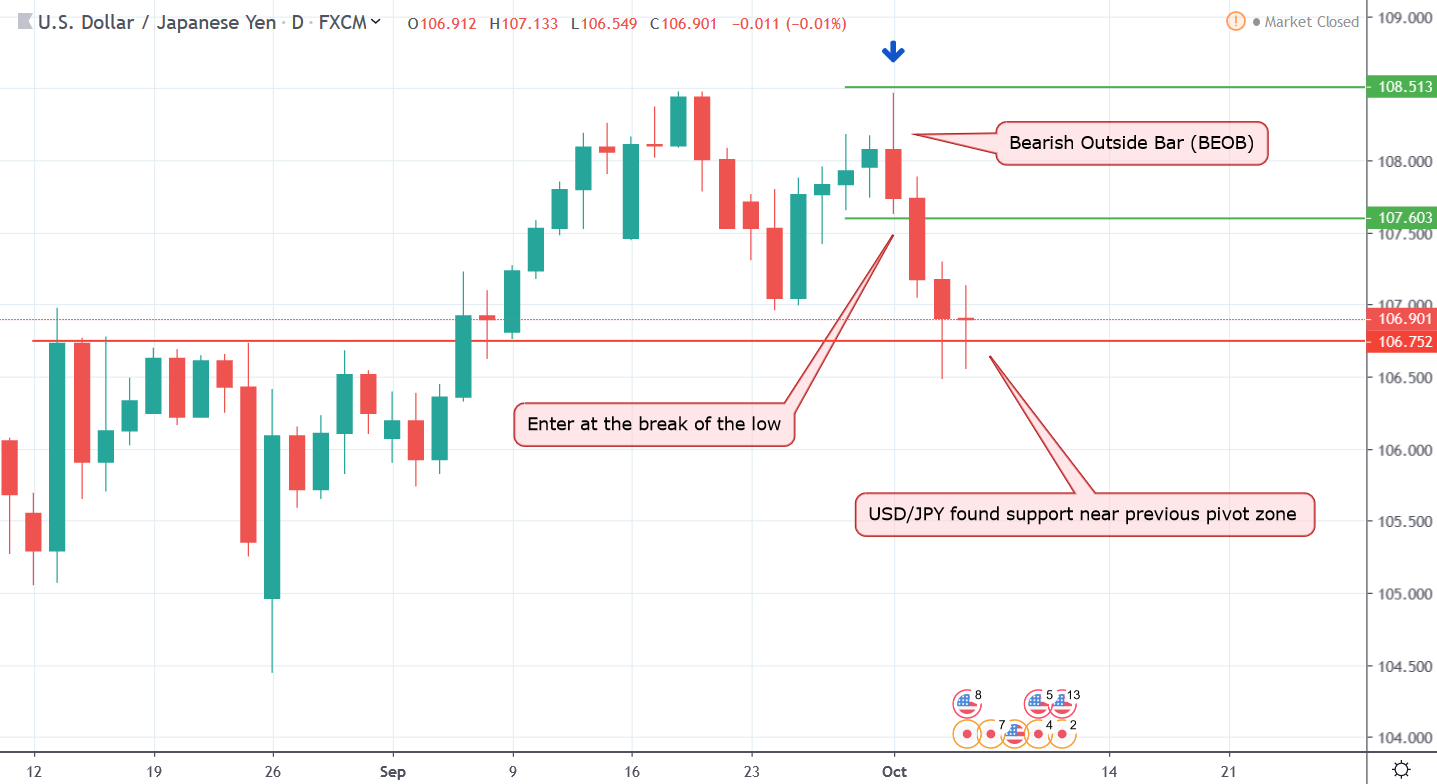
Confirmation: The Most Important Rule
One of the biggest mistakes traders make is trading candlestick patterns without confirmation.
A candlestick pattern is a signal, not a trade by itself.
Confirmation can come from:
- The next candle closing in the expected direction
- Increased trading volume
- A break of minor support or resistance
Examples:
- A hammer must be followed by a bullish candle
- A shooting star must be followed by a bearish candle
No confirmation means no trade.
Basic Trade Setup Using Candlesticks
Entry
Trades should be entered after confirmation, not on the pattern candle itself.
This reduces false signals and emotional decisions.
Stop Loss
- Below the low for bullish patterns
- Above the high for bearish patterns
The stop loss should always be clearly defined before entry.
Target
- Nearest resistance for bullish trades
- Nearest support for bearish trades
A minimum risk-to-reward ratio of 1:2 should be maintained.
Final Thoughts
Candlestick patterns do not predict the future.
They reveal market behavior.
When used correctly — with trend context, key levels, and confirmation — candlesticks become a powerful decision-making tool.
Successful trading is not about taking more trades.
It is about taking better, well-confirmed trades.