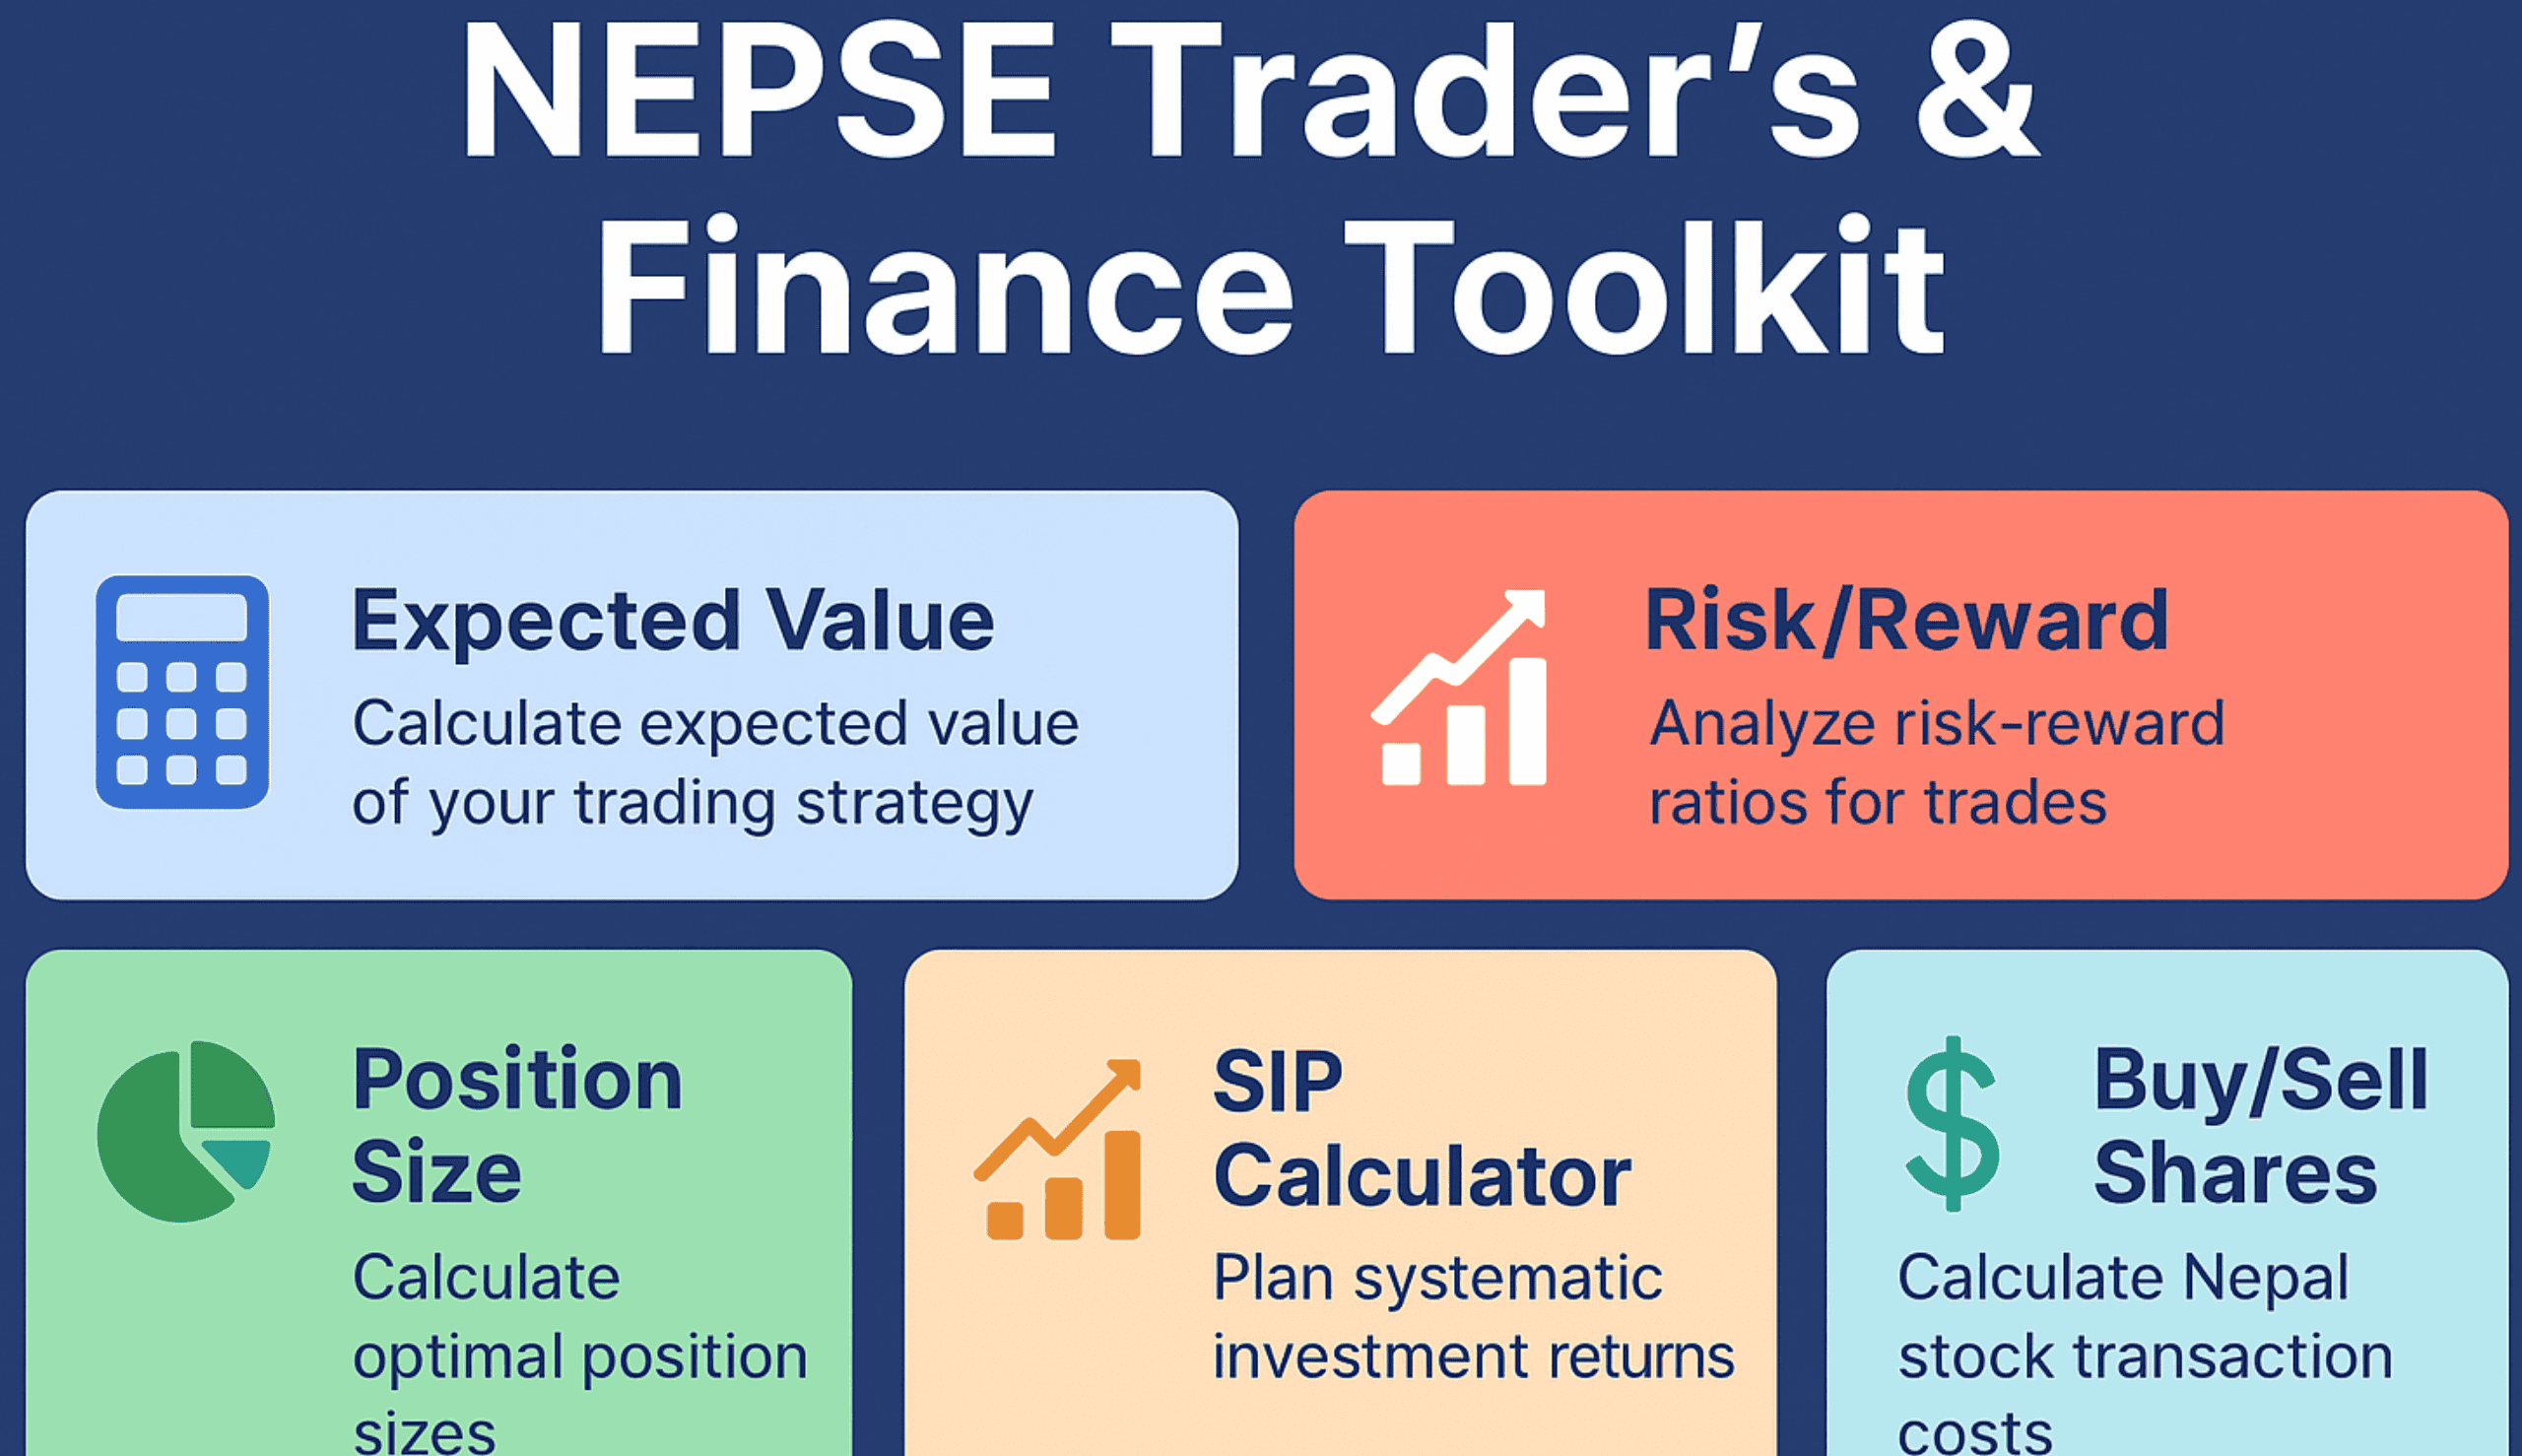
Welcome to the NEPSE Trader’s & Finance Toolkit – a one-stop solution for every Nepalese trader and investor who wants to manage trades, calculate risks, and plan investments with ease. This toolkit brings together five powerful calculators: Expected Value, Risk/Reward, Position Size, SIP (Systematic Investment Plan), and Buy/Sell Share Calculator. Each tool is built for real-world use in the Nepal Stock Exchange (NEPSE).
In this blog, we’ll explore how each calculator works, the formulas behind them, and how you can apply them in your trading or investing journey.
1. Expected Value Calculator
The Expected Value (EV) tells you whether your trading strategy is profitable in the long run. It combines your win rate, average profit, and average loss to give a single number.
Formula:
EV = (Win Rate × Average Reward) – (Loss Rate × Average Loss)
- Win Rate (%) → Probability of winning a trade.
- Average Reward → Profit you make when you win.
- Average Loss → Loss you take when you lose.
Example:
- Win Rate = 60%
- Average Reward = ₨15,000
- Average Loss = ₨8,000
EV = (0.6 × 15000) – (0.4 × 8000)
EV = 9000 – 3200 = ₨5,800
👉 This means on average you gain ₨5,800 per trade. Positive EV = profitable long-term strategy.
2. Risk/Reward Calculator
Every trader must know how much they are risking vs. how much they could earn. The Risk/Reward (R/R) Ratio helps you analyze this.
Formulas:
Risk per Share = Entry Price – Stop Loss
Reward per Share = Target Price – Entry Price
Risk/Reward Ratio = Risk ÷ Reward
Break-even Win Rate = Risk ÷ (Risk + Reward)
Expected Value per ₨ Risked = (Win Rate × Reward – Loss Rate × Risk) ÷ Risk
Kelly Criterion = (bp – q) ÷ b
Where:
- b = Reward ÷ Risk
- p = Probability of winning
- q = Probability of losing (1 – p)
Example:
- Entry Price = ₨1000
- Stop Loss = ₨950 → Risk = ₨50
- Target Price = ₨1100 → Reward = ₨100
- R/R Ratio = 1:2
- Break-even Win Rate = 33.3%
- Kelly Criterion = 40%
👉 If your win rate is 60%, this trade is profitable. The Kelly result (40%) suggests the optimal portion of your account to risk, though traders often risk less for safety.
3. Position Size Calculator
Managing position size is the heart of risk management. It ensures you never risk more than your comfort level.
Formulas:
Risk Amount = Account Size × Risk %
Risk per Share = Entry Price – Stop Loss
Position Size = Risk Amount ÷ Risk per Share
Total Investment = Position Size × Entry Price
Example:
- Account Size = ₨500,000
- Risk % = 2% → Risk Amount = ₨10,000
- Entry = ₨1000, Stop Loss = ₨950 → Risk per Share = ₨50
- Position Size = 10,000 ÷ 50 = 200 shares
- Investment = 200 × 1000 = ₨200,000
👉 With 200 shares, your maximum loss is ₨10,000 (2% of account). This keeps your capital safe.
4. SIP Calculator
A Systematic Investment Plan (SIP) is the best way for long-term wealth creation. By investing a fixed amount regularly, you benefit from compounding and rupee cost averaging.
Formula:
Maturity Amount = P × [(1 + r/n)^(n×t) – 1] ÷ (r/n)
Where:
- P = Monthly Investment
- r = Annual Return Rate
- n = 12 (months in a year)
- t = Number of years
Example:
- Monthly = ₨10,000
- Period = 10 years
- Return = 12%
👉 Maturity = ₨23,23,390.76 (Investment: ₨12,00,000, Gains: ₨11,23,390.76)
📌 SIP Benefits:
- Smooths market volatility
- Builds wealth steadily
- Harnesses compounding
- Requires small regular commitment
5. Buy/Sell Share Calculator
When buying or selling shares in Nepal, you don’t just deal with price × quantity. Extra charges and taxes apply.
Buy Transaction
Formula:
Total Payable = (Quantity × Price) + Brokerage + SEBON Fee + DP Charge
Example:
- 100 shares × ₨1000 = ₨100,000
- Brokerage (0.4%) = ₨400
- SEBON Fee (0.015%) = ₨15
- DP Charge (0.005%) = ₨5
- Total = ₨100,420
Sell Transaction
Formula:
Net Receivable = (Quantity × Sell Price) – (Brokerage + SEBON Fee + DP + Bank Charge + Capital Gains Tax)
Profit/Loss = Net Receivable – (Quantity × Buy Price)
Example:
- Sell: 100 shares × ₨1000 = ₨100,000
- Buy Price = ₨800 × 100 = ₨80,000
- Charges = ₨1,445
- Net Receivable = ₨98,555
- Profit = ₨18,555 (+23.19%)
📌 Charges in NEPSE:
- Brokerage: 0.3% – 0.6%
- SEBON Fee: 0.015%
- DP Charge: 0.005% (max ₨25)
- Bank Charge: ₨25 (sell only)
- Capital Gains Tax: 5% (individual), 25% (institutional)
Final Takeaway
The NEPSE Trader’s & Finance Toolkit is designed to simplify your trading and investing decisions. From analyzing expected profits, managing risks, sizing positions, planning SIPs, to calculating actual buy/sell costs — this toolkit helps you make informed, disciplined financial decisions.
👉 Try it yourself here: NEPSE Trader’s & Finance Toolkit
Remember: tools give clarity, but success in trading comes from discipline, consistency, and risk management.